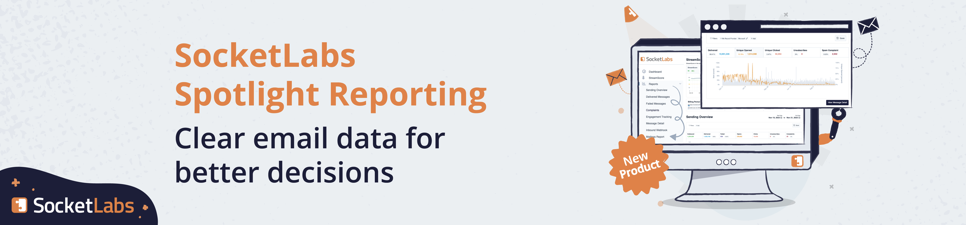
Your first step toward better email starts at your account overview dashboard, where comprehensive performance data is aggregated into at-a-glance, color-coded indicators. Plus, you won’t be shoehorned into making sense of the dashboard we give you.
You can build your own sender overview to meet your specific needs. Choose from a long list of filters, save the right views, and share the dashboard easily to keep everyone on the same page.
Set your sights on brighter email horizons with up to 13 months of aggregate internal and external data powered by Snowflake! With simple but comprehensive views of engagement, mailbox provider-level insight, and areas ripe for improvement, our data sets are deeper and richer than ever, including year-over-year trends to help you anticipate seasonal waves.
Not a huge sender? Not a huge problem. All our customers get at least 30 days of aggregate performance data AND seven days of detailed information to help you plan your next move.
Chart a path to success
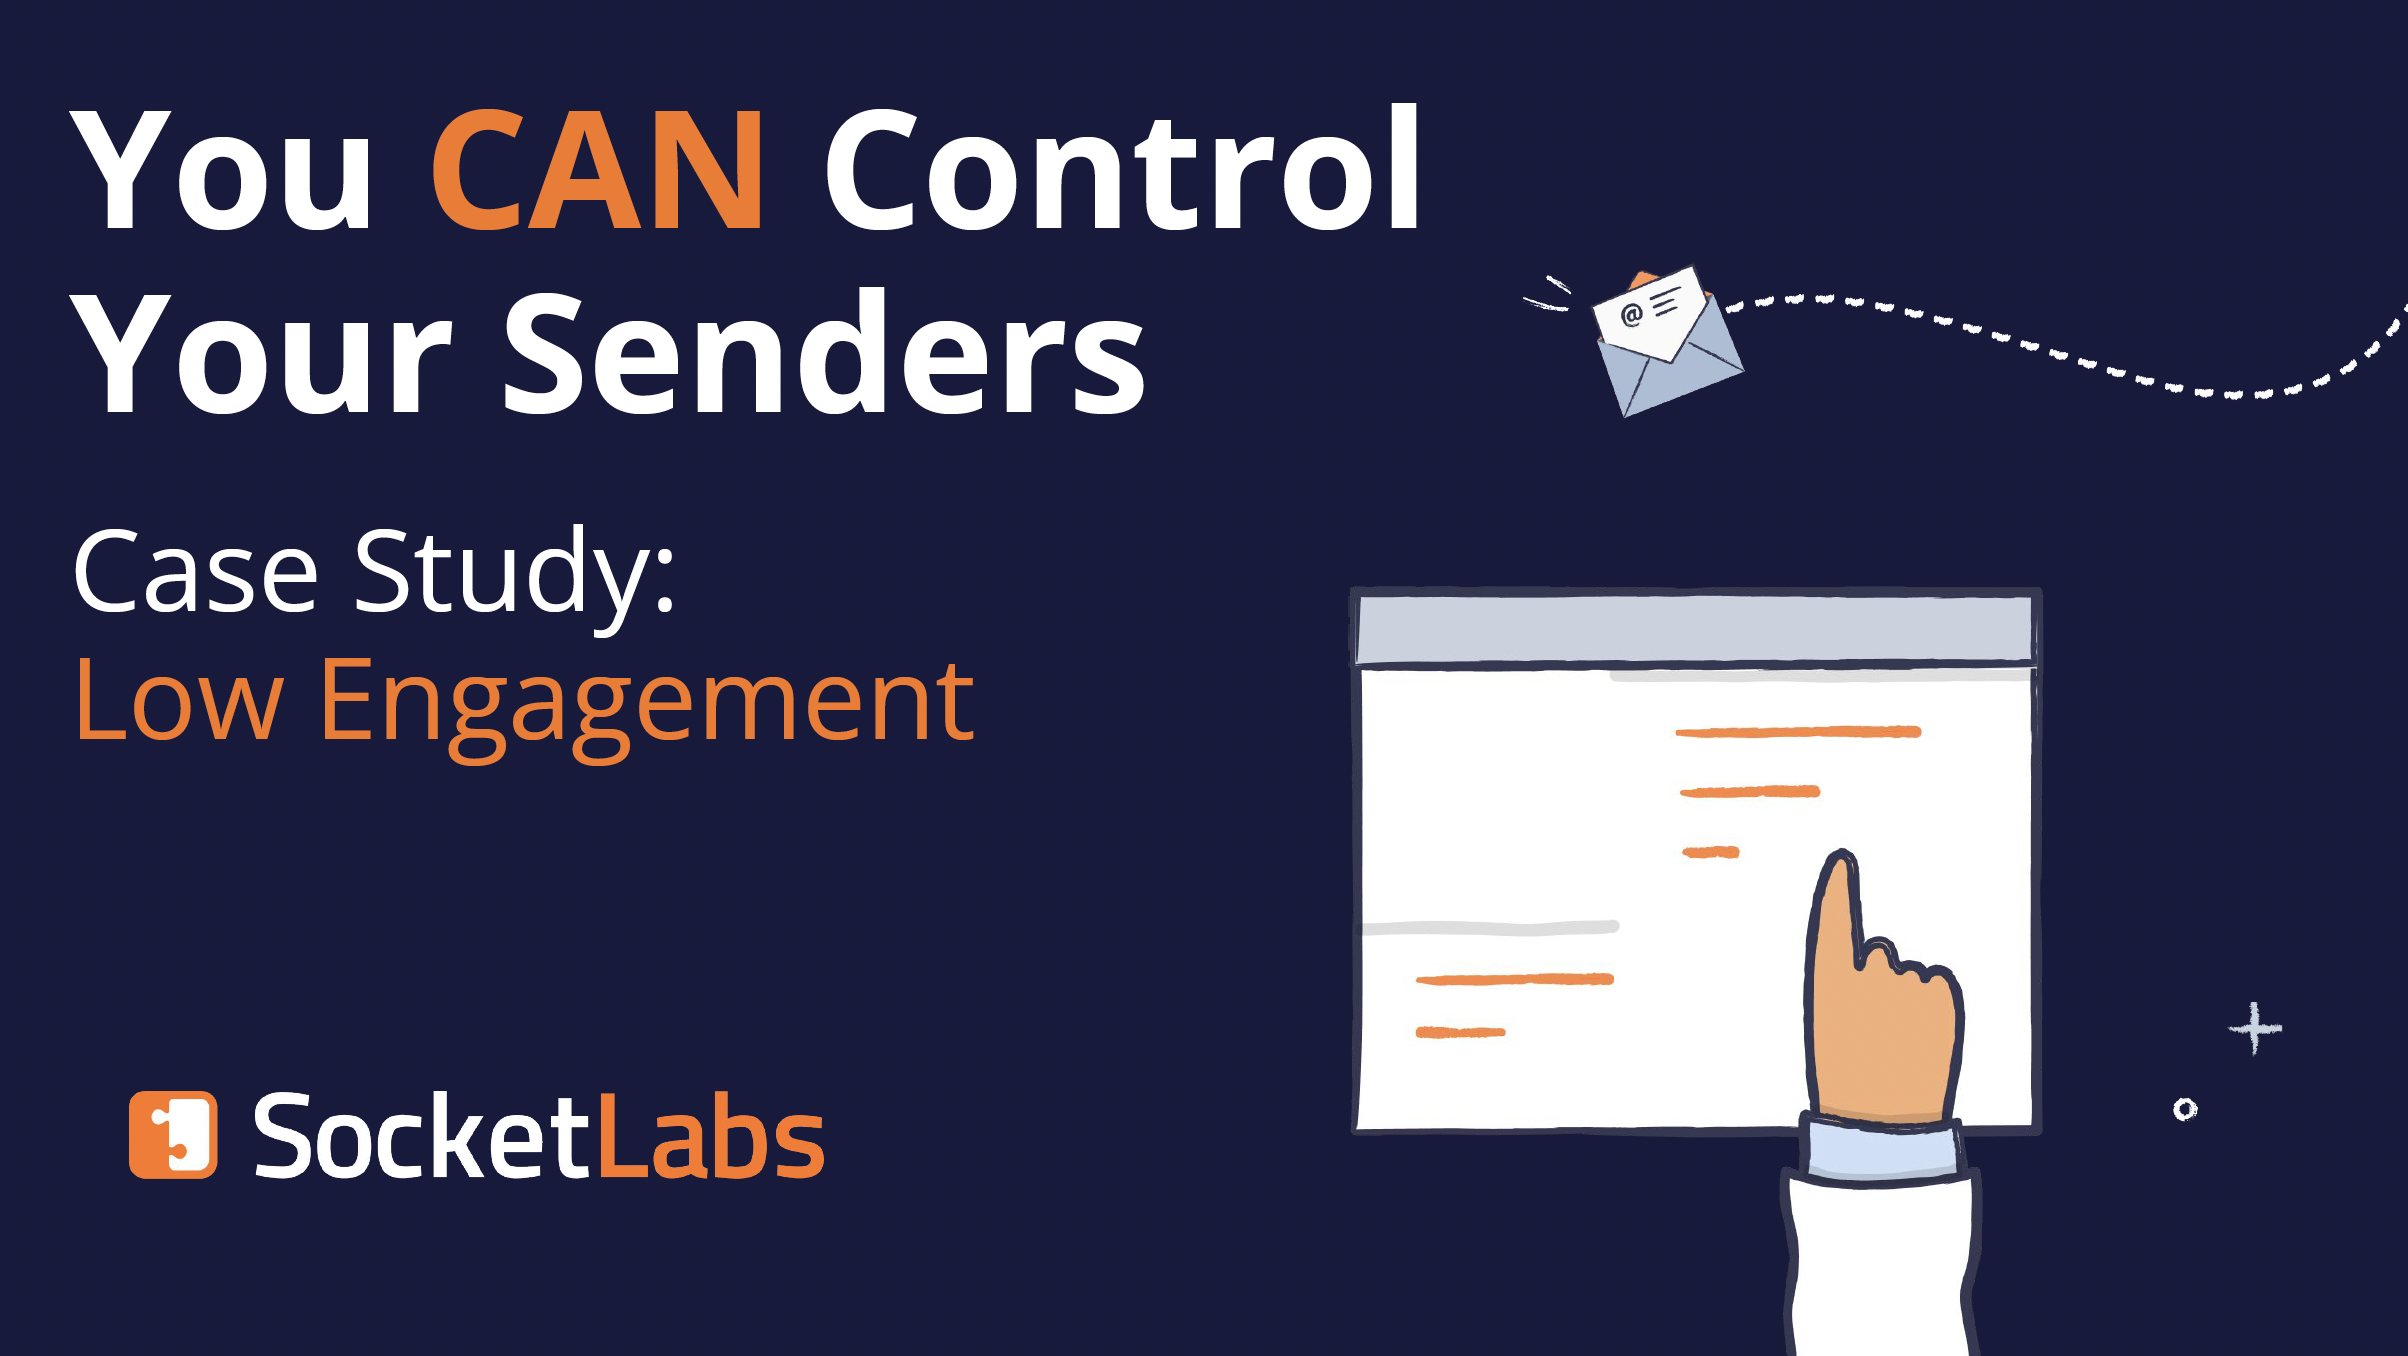
We don’t just stop at data. Our StreamScore looks at data from four major categories, including engagement, reputation, audience, and security, so you can see exactly what elements of your email practice need some work.
Once you’re there, we even provide directional guidance to help you create a path to success. We noticed a lot of hard bounces? We’ll suggest you clean your lists. Plus, that advice is right there in the app; no need to wait for someone to come to your aid!
While we do provide lots of in-platform guidance to help you make your next moves, we know sometimes that’s just not enough. So, to be truly supportive partners, we have a team of email experts ready to assist you when you need it.
Don’t wait for days on end just to get someone not familiar with email to return your message. Trust us, real humans with real email knowledge, to be there when you need it.
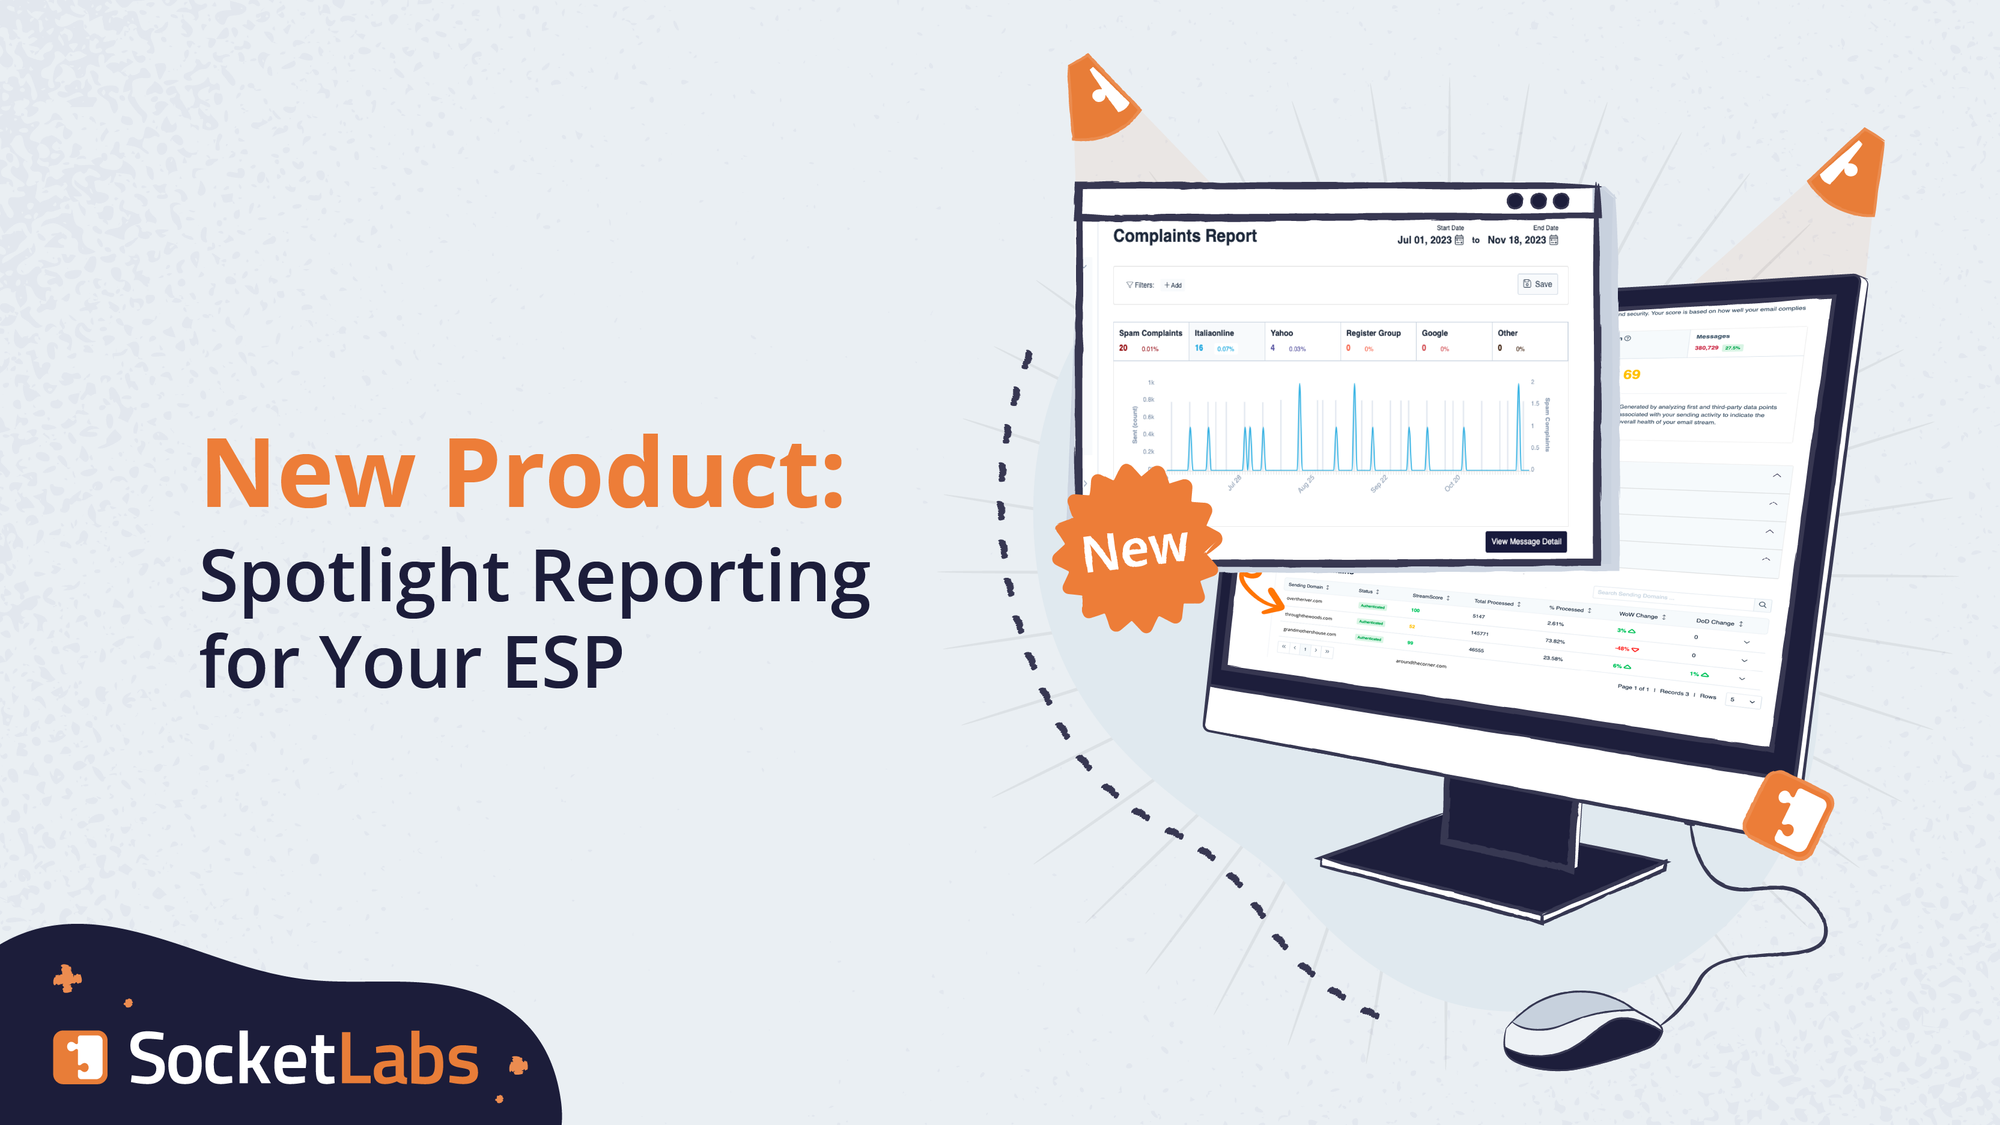
Reporting for duty
This is just the tip of the iceberg for our suite of reporting tools, bringing you the easiest way to protect and optimize performance, no matter how many emails you send. Read more in our blog.
Build one at-a-glance dashboard to track account-wide performance based on the filters you want for the insights you need.
These folks enjoy the SocketLabs difference
"SocketLabs is clearly driven by customer success and has become a trusted partner of SignUp.com"
Patrick Dyson
CTO, SignUp.com
"It was like a breath of fresh air having something that we could plug into in our environment, and make a few customizations, and be up and running in the blink of an eye."
Kevin Baker
Technical Director, eProductive
"We should have transitioned a long time ago. With SocketLabs, we're not just a number. I've got the name of a person I can ring up if I've got a problem."
Alec Dobbie
CEO, Fanfinders
"We always want to be at the forefront of the marketing automation world, and SocketLabs helps us do that."
Peter Malm
Email Specialist, APSIS
"We've been working together for at least 8 years, and we wouldn't trust anybody else with our email delivery."
Lindsay Willott
CEO, Customer Thermometer
"Ultimately, we realized that email is an incredibly specialized area requiring dedicated, expert resources. We saw vast improvement after switching to SocketLabs’ managed email service."
Jim Voss
EVP of Technology & Information Security, Bridgeline
")