Email reporting tools can be fickle. Sometimes you get lots of data, which is a yay moment, but you don’t get enough context to do much with it. Boo. Other times you’ll get lots of charts and graphs to make things look like a story, yay, but the data is shallow and only accounts for surface-level metrics like aggregate opens across the entire landscape. Major boo.
Not here, no way.
Your data should give you the context you need to make your next move. You need adequate context around the move so you can see what changes.
So that’s what we do. When you send with SocketLabs you get a completely new and more information-packed reporting experience. This means tons of data and tons of unique ways to see it, absorb it, and use it to improve your email performance.
We built the new email reporting experience from the ground up
If you’re familiar with SocketLabs reporting in any way, you’ll notice the way it looks today is completely unrecognizable from what it used to be. This is great for all of us – we get to enjoy the unveiling together regardless of whether you’re a current or future customer.
The main differentiator between now and yesterday is a little [not] secret weapon called Snowflake. By using Snowflake within our architecture, we’re able to process a lot of data really quickly, accurately, and securely.
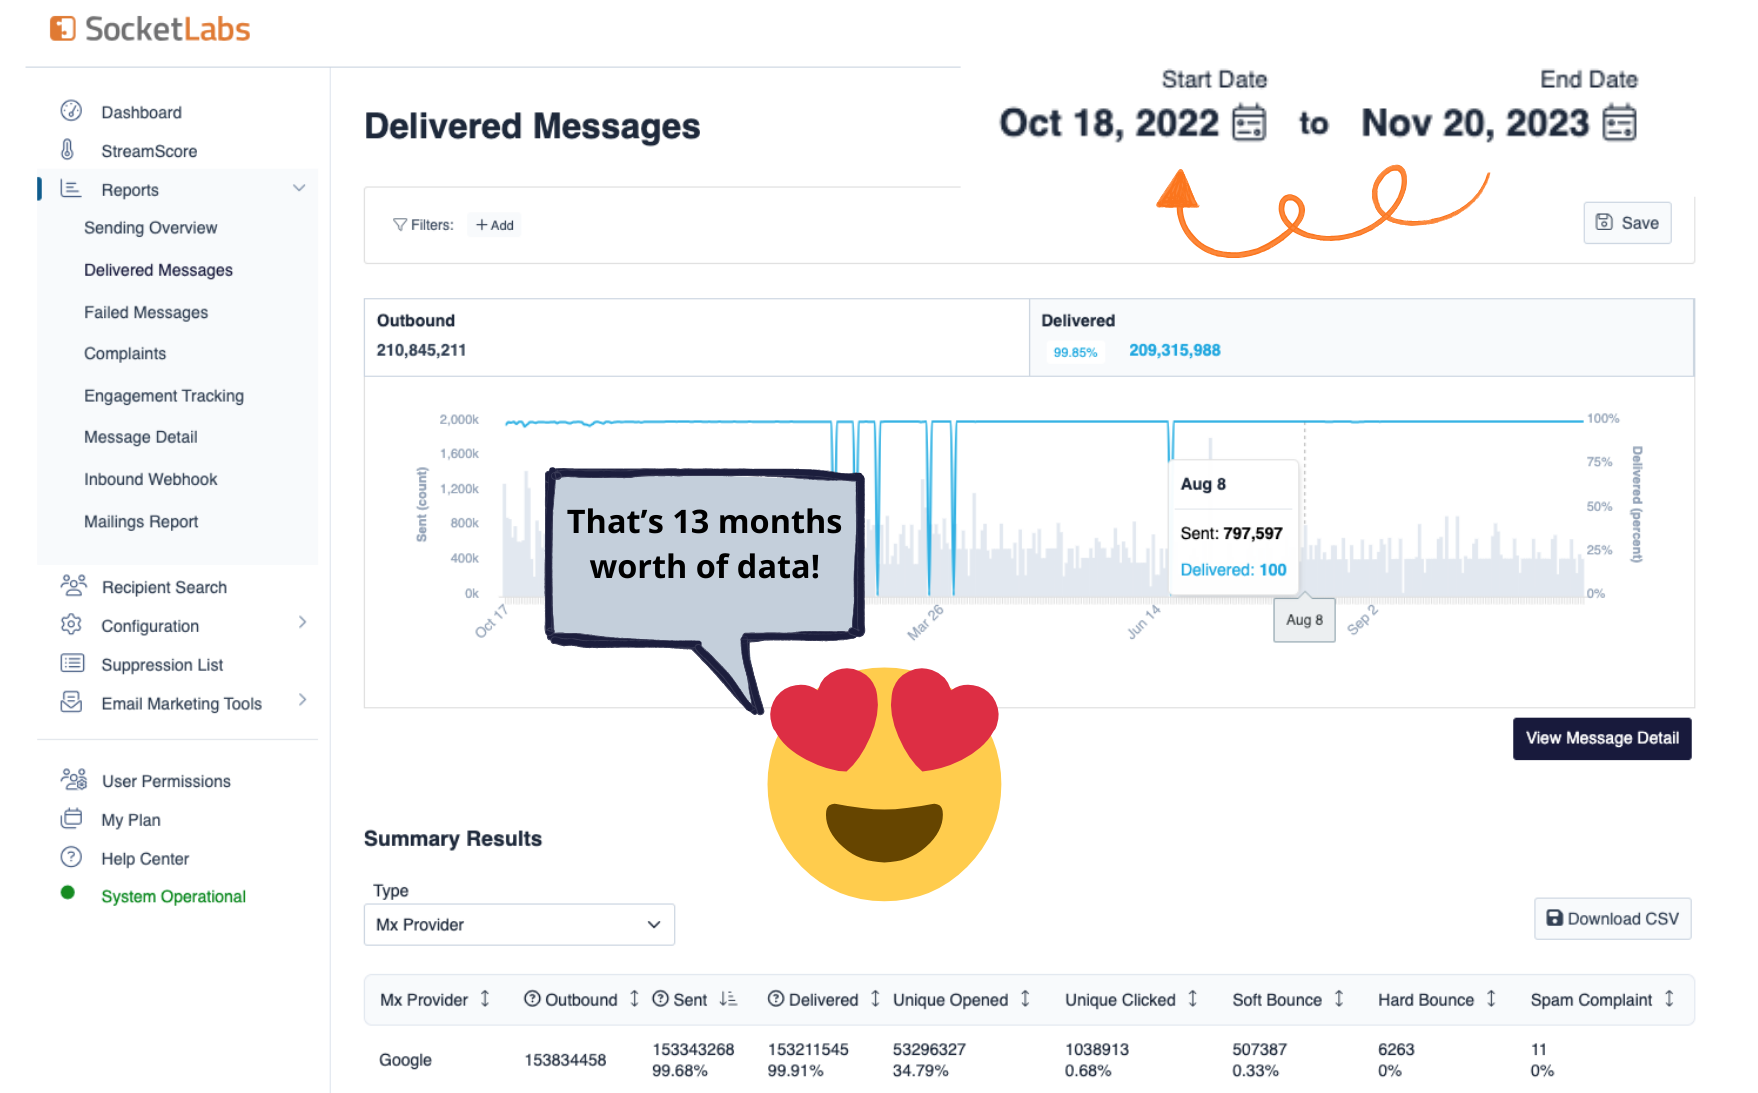
By a lot, we mean, like…a lot. Try 13 months’ worth of email data processed at the tap of your finger. It won’t take 13 months to process, either. You’ll be ready to go in less than a minute. We’re also making updates at a lightning pace, so you can expect more visualization options, more powerful filters, and better experiences on an ongoing basis.
Join us as we take a walk on the wild side of email reporting! Here’s what you’ll get as a SocketLabs sender.
More data
Lots of ESPs have lots of data, that’s true. But how much data do they give you access to? For example, SendGrid restricts reporting at 100 million emails or more, leaving you blind to information that could make a real difference in your email performance. They don’t even offer the features at a higher cost. You just…don’t get them (look for the telltale ** in the reporting section of their pricing page.)
So, if you’re a sender with high volume and you want to get the benefit of every reporting capability your ESP has to offer, stick with us because we won’t remove features just because you have a lot of email to send.
Instead, we’ll tell you this: Our new email reporting tool will give you more information than you’ve had before without limiting your data access based on your volume.
One of the most exciting features we’re adding is the amount of data we get from mailbox providers. Now you’ll see how your mail is being treated by specific mailboxes such as Google and Microsoft and their users. You’ll be able to tailor your approach by mailbox if you see something working better there than at other places.
We aren’t just talking about data from third parties, either. We have more data all around.
With SocketLabs, enterprise senders can access 13 months of email data on an aggregate level and detailed reporting on 90 days of data. Our Pro senders get 30 days of detailed reporting with 90 days of aggregate information and Core senders get 7-day detail and 30-day aggregate.
Before we get into ways you can look at the data, there’s another important improvement to note.
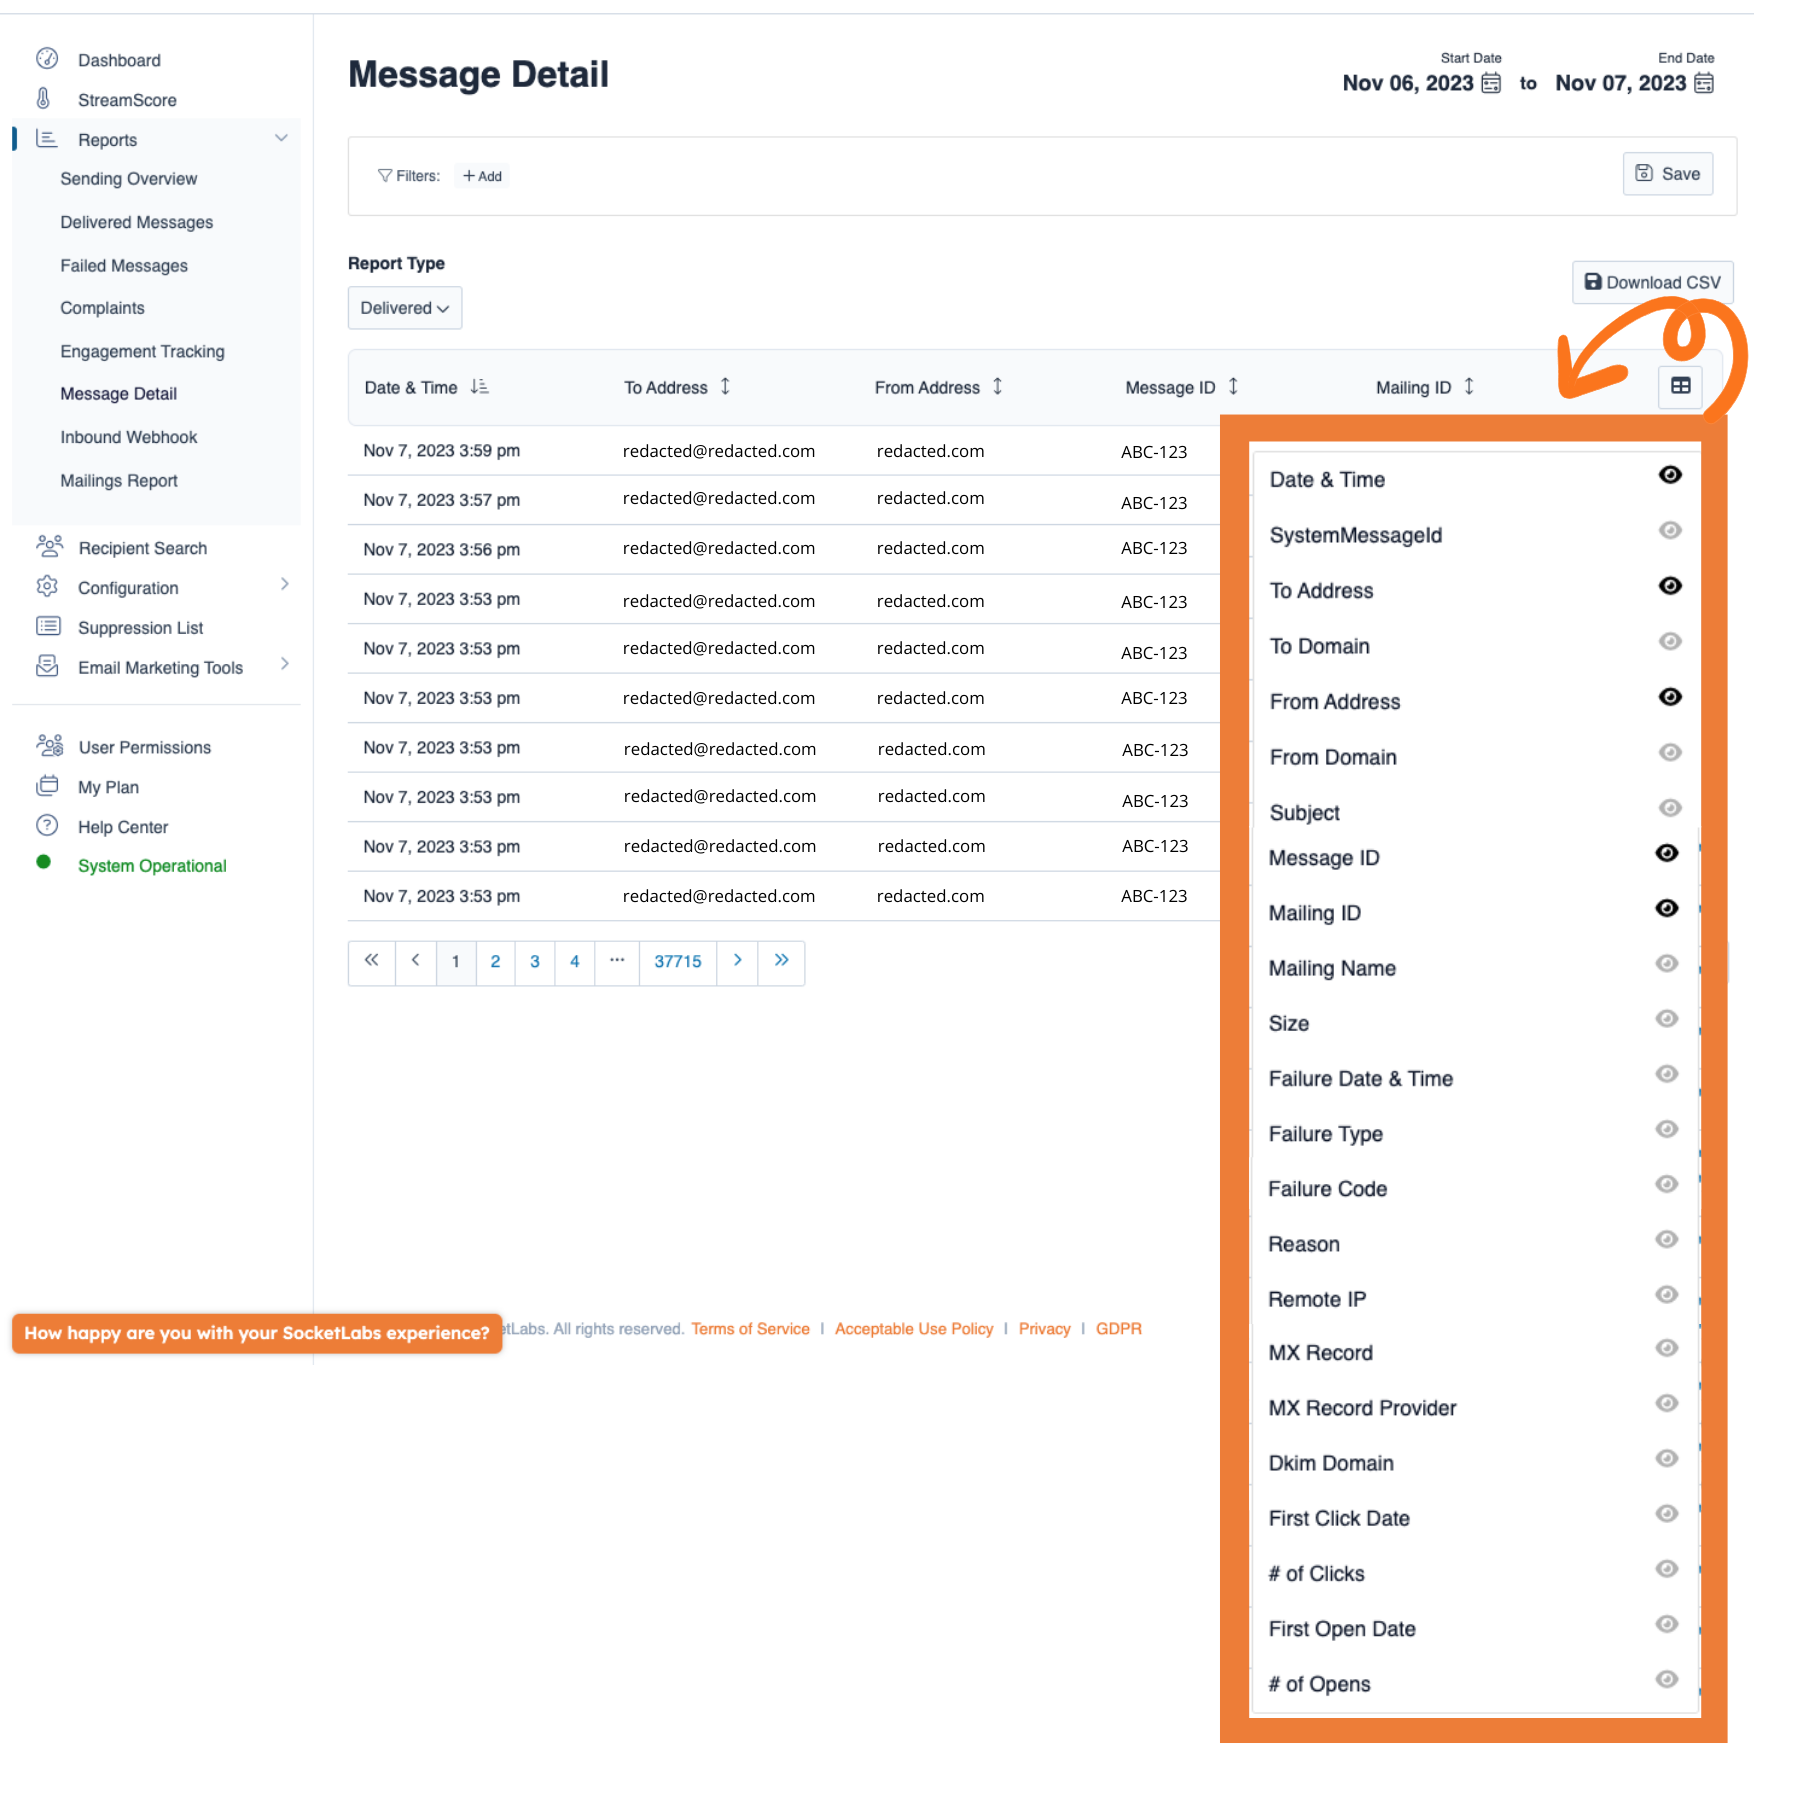
Unlike at other ESPs, you don’t need to lasso your data manually by comparing two sets of aggregate event data and tying them together to exact events to analyze and make changes. We help you to very quickly see not just how many clicks you get on 10,000 delivered messages, but we can show yout your unique opens are down…but only at Microsoft. That’s information you can actually use to know what’s wrong, plus we give you a snazzy visual you can share with anyone who wants to track performance.
![]()
Woah.
Another woah: Even when you’re analyzing millions of messages over 13 months with this level of granularity, you won’t sit around for what feels like 13 months just to see the data. We’re faster than ever. For example, we have a customer sending more than 200 million per month (ahem, double SendGrid’s limit for reporting…even when you’re willing to pay more). Loading up 395 days worth of data so they can review year-over-year trends takes less than a minute.
More visualization
OK, now we know what we’re working with in our reporting tool. What can you create with the data?
Basically everything you need to build a visual guide to your email performance. Stop cobbling together disparate pieces of data and instead, tell the data to cobble itself and you can sit back and wait until it’s done.
Forget manually tracking trends. No more finger-breaking labor to find anomalies. We’ll visualize all this for you to turn your data into a story you can use to inform your future decisions.
What kind of images are we talking about? Pretty much anything you would want to do with email data.
For instance, you can compare IP addresses over a specific amount of time. Or, for those with multiple senders on their account, you can see one sender’s performance measured against the average performance of all senders, all in one view. We don’t love to be narcs on your less-than-great senders but…an ESP’s gotta do what an ESP’s gotta do.
 And of course, we would never release this kind of data magic into the world without allowing you to get just about any data set you want, filters included, in a graph to illustrate the information in an easy-to-understand way.
More clarity
Remember how we said with other ESPs, you need to manually compare two different data sets to find correlations or patterns, then make assumptions about the analysis?
Here, we cross-filter all that data to give you a confirmed look at what’s happening in a single report. You won’t have to make decisions based on a leap of faith between two separate reports. Not anymore.
For our friends with multiple servers or subaccounts, you’ll get an account-wide sending overview to see where you need to focus your attention. On that account-level reporting page, you can lump together similar subaccounts into one report to isolate those trends away from others.
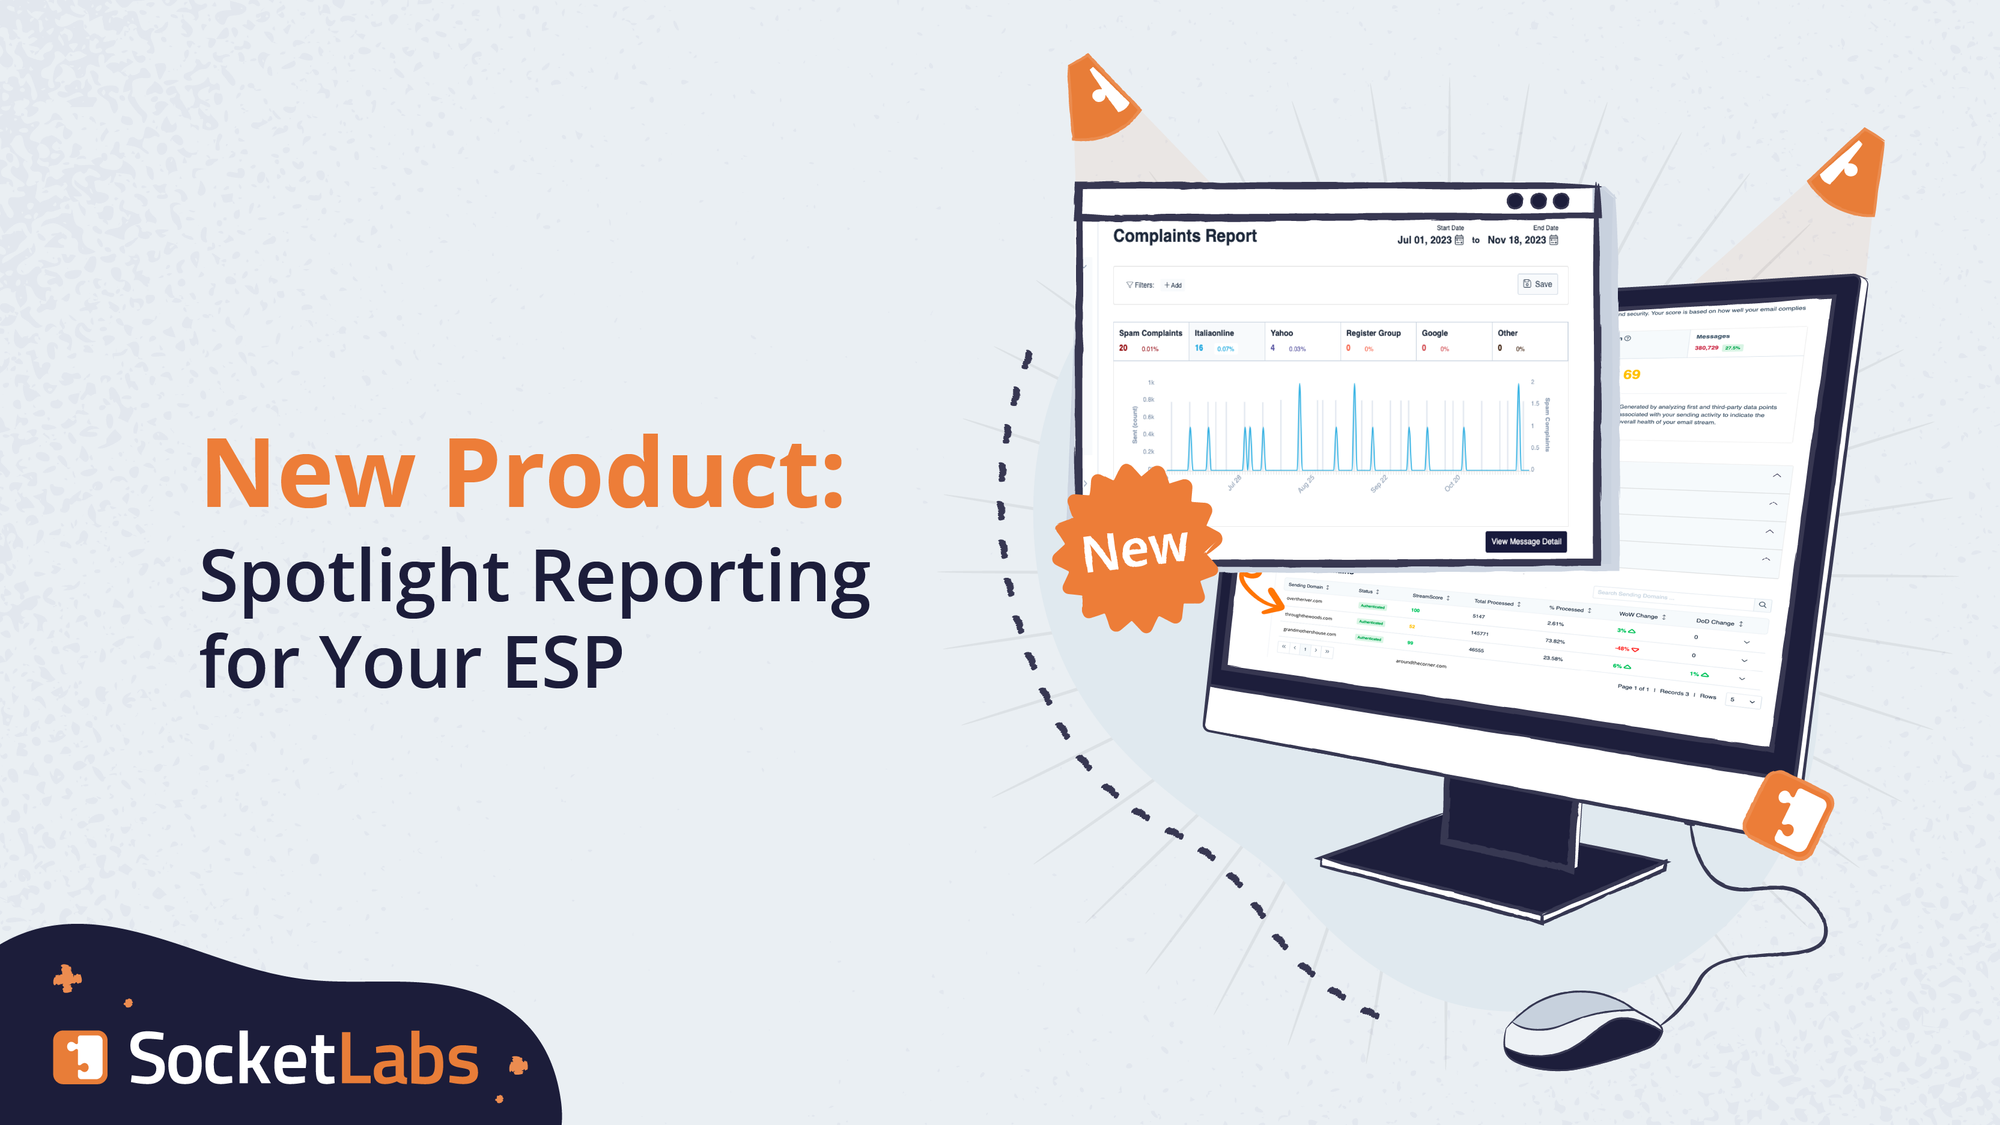
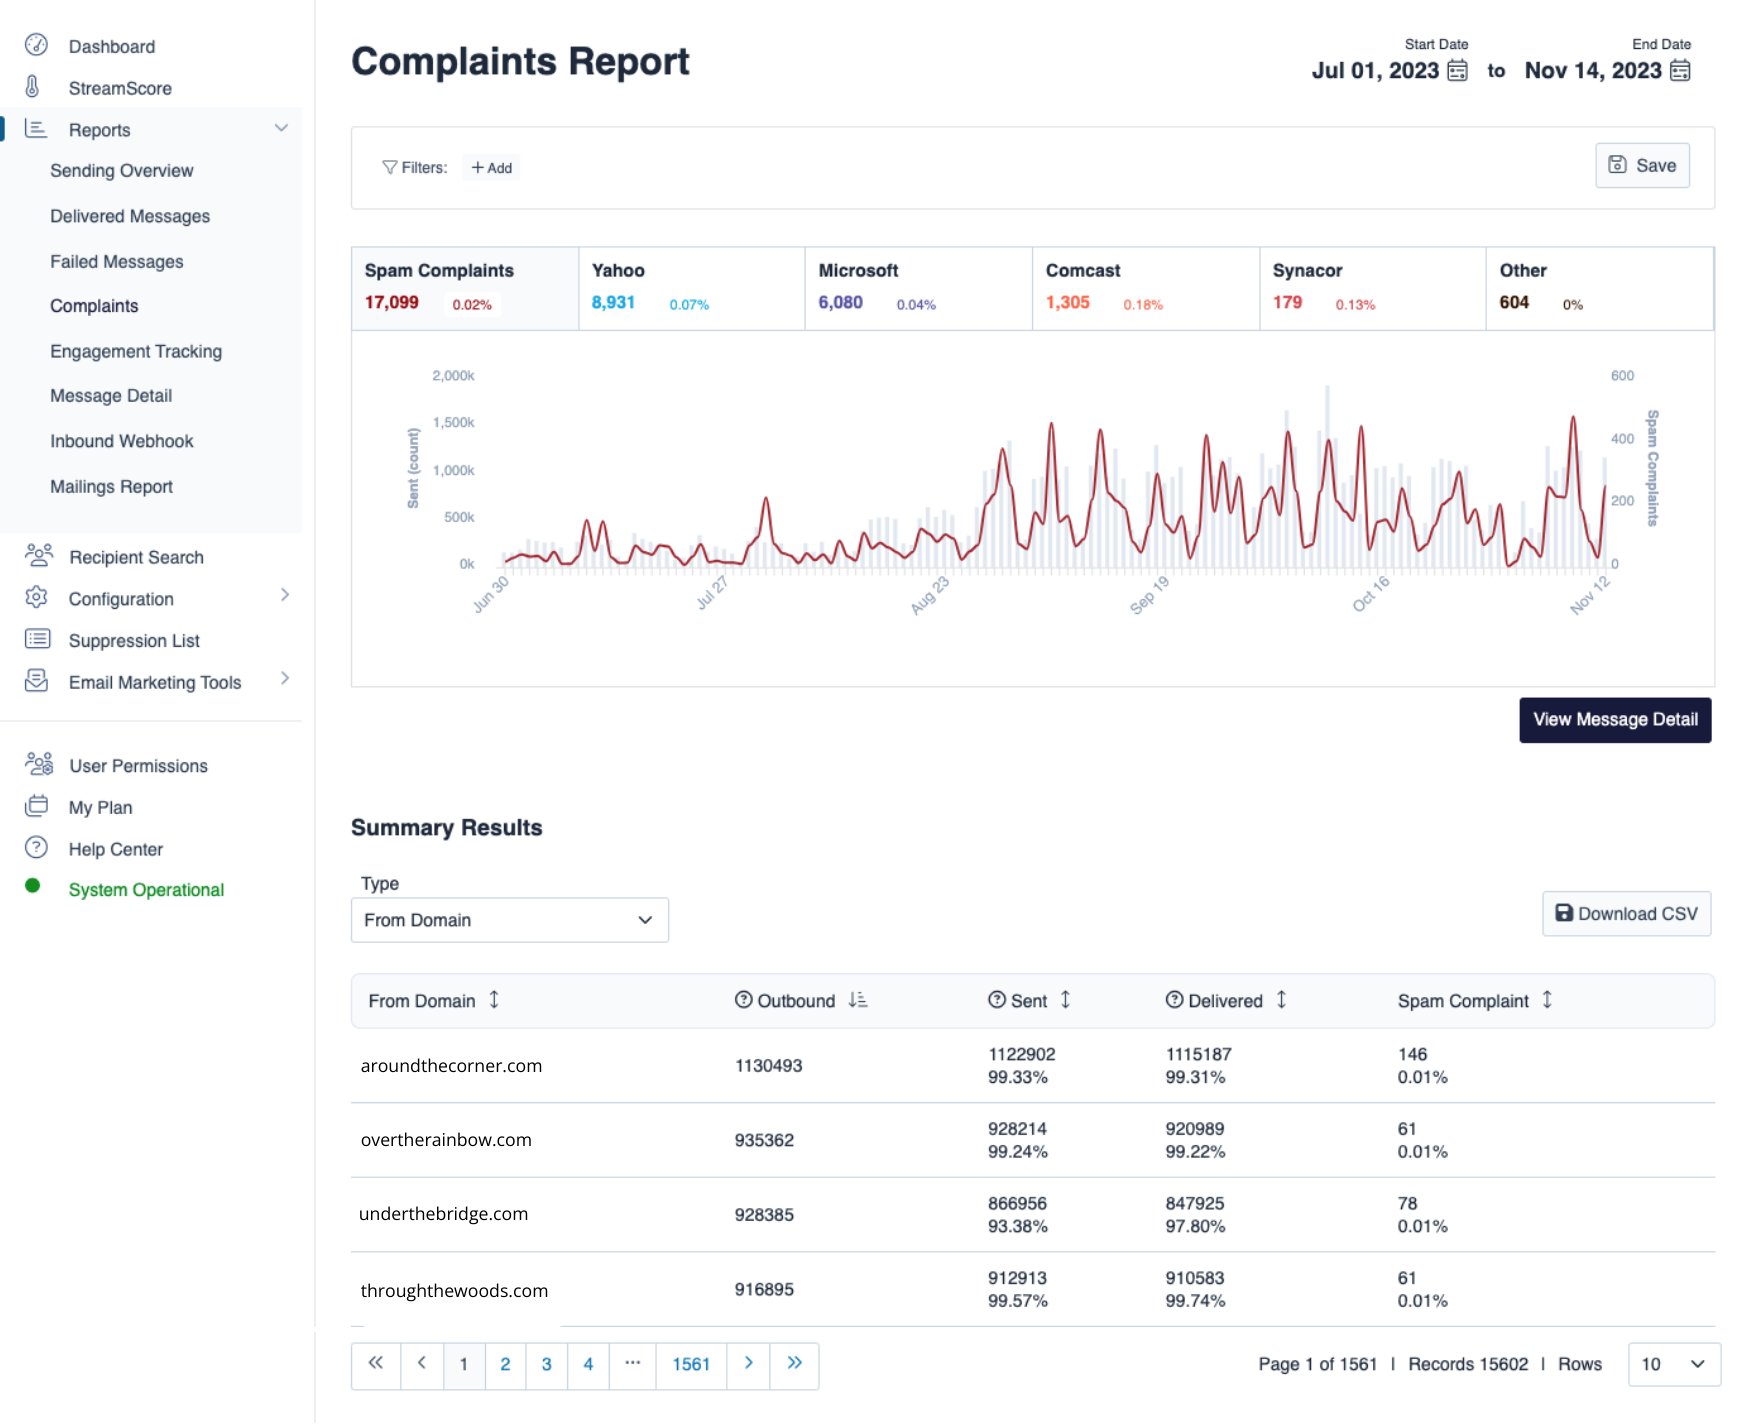
A historically pitch-black blind spot senders face with other ESPs is how complaints are tracked. This is something deserving a bit of the spotlight, so we rolled out improvements there, too.
Some ESPs (yet, not all) provide you with some complaint visualizations but they typically only use information received from the top B2C mailbox providers like Gmail, Yahoo, and so on. Other domains? Sorry, they can’t do that. Too many numbers to crunch. Cannot compute.
We can, though. We visualize the top 5 mailboxes you’re receiving spam complaints from so you can see how those are trending over time and deal with them, fast. That’s fun! Take a look, there’s Mail.ru!
Is that…no…it couldn’t be… is that Italiaonline?!
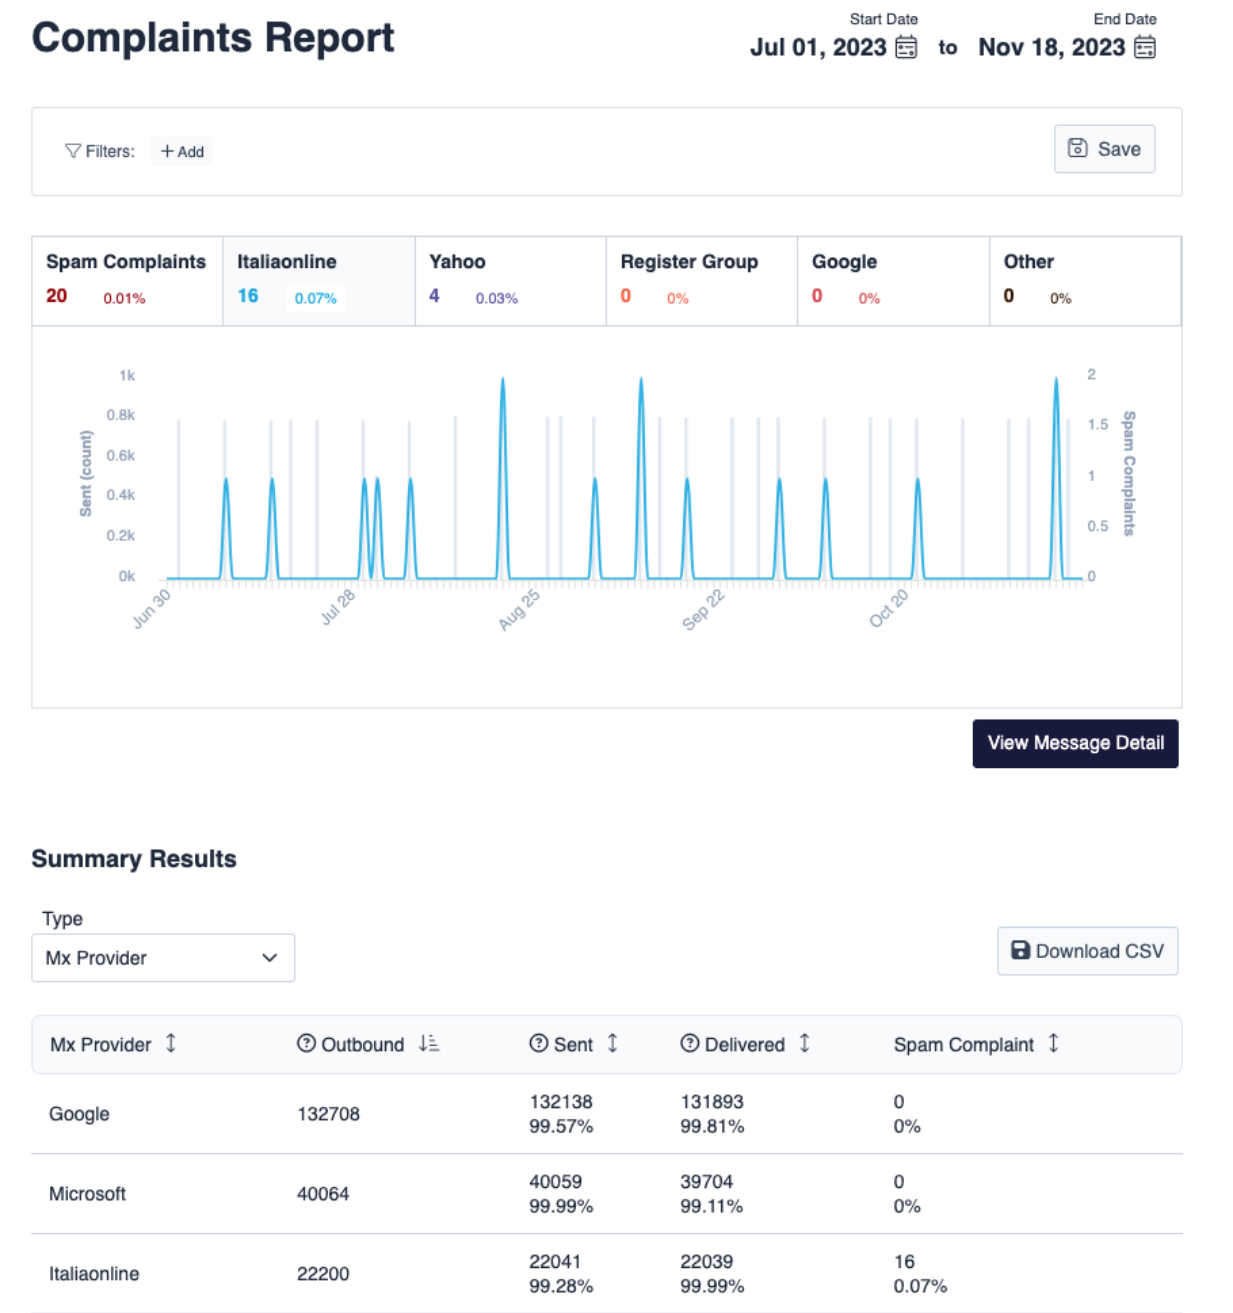
Yes, it is! Spam complaints don’t stop at Yahoo, Microsoft, and Comcast so why should we?
Finally, when it comes to clarity, we would be remiss if we didn’t mention the little ways we’re making it easier for you to advocate for your email program. With our reporting tool, you can share a URL leading to an exact dashboard to allow people to see what you need them to see (provided they have the proper permissions).
Let’s say your VP of Major Decisions About Email is a permissioned viewer of the reports you access on a daily basis. She doesn’t mess around, but if she wants to, she can get in and take a looksie.
You can create a very compelling visual argument rooted in the data you find here and then simply share that URL with your VP. No trying to find the right filter, no more frustrated clicking. It’s a click and voila.
More value
Even though this isn’t the sexiest part of the reveal for email nerds like us, it is very much worth noting: None of this will cost you a fortune because it’s all part of the deal.
If you send with SocketLabs in any capacity, you will get the benefits of our email reporting. You don’t need to pay an arm and a leg to make informed, confident decisions. That should be inherently part of the value of an ESP. At least, it is here.
From the smallest senders to the biggest senders around, we can accommodate your needs. We’re not in the business of volume-limited data, remember.
Final Thoughts
Here’s the long and short of it: We leveled up our reporting. You can’t get this level of data anywhere else, even at the really big ESPs who SHOULD be giving you every crumb of data they are storing for the amount you pay them…
Anyway, this is such an easy way to improve your email performance. There’s more information and guidance. You get more historical context and improved trendspotting. With all this data, you can make the most confident decisions you’ve ever made.
Try it yourself. Our free trial will give you access to reporting so you can see the difference it will make for your performance. Not much to lose with a free trial, is there?
Go ahead and click, and we’ll see you next time.